
Overview
| docs | |
|---|---|
| tests |        |
| package |      |
Hunter is a flexible code tracing toolkit, not for measuring coverage, but for debugging, logging, inspection and other nefarious purposes. It has a Python API, terminal activation (see Environment variable activation). and supports tracing other processes (see Tracing processes).
- Free software: BSD license
Installation
pip install hunter
Documentation
Overview
The default action is to just print the code being executed. Example:
import hunter
hunter.trace(module='posixpath')

import os
os.path.join('a', 'b')
Would result in:
>>> os.path.join('a', 'b')
         /usr/lib/python3.5/posixpath.py:71    call      def join(a, *p):
         /usr/lib/python3.5/posixpath.py:76    line          sep = _get_sep(a)
         /usr/lib/python3.5/posixpath.py:39    call      def _get_sep(path):
         /usr/lib/python3.5/posixpath.py:40    line          if isinstance(path, bytes):
         /usr/lib/python3.5/posixpath.py:43    line              return '/'
         /usr/lib/python3.5/posixpath.py:43    return            return '/'
                                               ...       return value: '/'
         /usr/lib/python3.5/posixpath.py:77    line          path = a
         /usr/lib/python3.5/posixpath.py:78    line          try:
         /usr/lib/python3.5/posixpath.py:79    line              if not p:
         /usr/lib/python3.5/posixpath.py:81    line              for b in p:
         /usr/lib/python3.5/posixpath.py:82    line                  if b.startswith(sep):
         /usr/lib/python3.5/posixpath.py:84    line                  elif not path or path.endswith(sep):
         /usr/lib/python3.5/posixpath.py:87    line                      path += sep + b
         /usr/lib/python3.5/posixpath.py:81    line              for b in p:
         /usr/lib/python3.5/posixpath.py:91    line          return path
         /usr/lib/python3.5/posixpath.py:91    return        return path
                                               ...       return value: 'a/b'
'a/b'
- or in a terminal:
Custom actions
The tracer allow custom actions like CallPrinter or VarsPrinter.
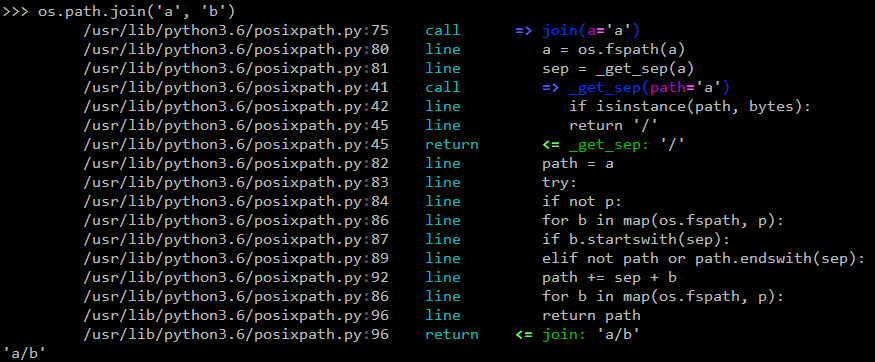
With CallPrinter (added in hunter 1.2.0, will be the default action in 2.0.1):
import hunter
hunter.trace(module='posixpath', action=hunter.CallPrinter)

import os
os.path.join('a', 'b')
Would result in:
>>> os.path.join('a', 'b')
         /usr/lib/python3.5/posixpath.py:71    call      => join(a='a')
         /usr/lib/python3.5/posixpath.py:76    line         sep = _get_sep(a)
         /usr/lib/python3.5/posixpath.py:39    call         => _get_sep(path='a')
         /usr/lib/python3.5/posixpath.py:40    line            if isinstance(path, bytes):
         /usr/lib/python3.5/posixpath.py:43    line            return '/'
         /usr/lib/python3.5/posixpath.py:43    return       <= _get_sep: '/'
         /usr/lib/python3.5/posixpath.py:77    line         path = a
         /usr/lib/python3.5/posixpath.py:78    line         try:
         /usr/lib/python3.5/posixpath.py:79    line         if not p:
         /usr/lib/python3.5/posixpath.py:81    line         for b in p:
         /usr/lib/python3.5/posixpath.py:82    line         if b.startswith(sep):
         /usr/lib/python3.5/posixpath.py:84    line         elif not path or path.endswith(sep):
         /usr/lib/python3.5/posixpath.py:87    line         path += sep + b
         /usr/lib/python3.5/posixpath.py:81    line         for b in p:
         /usr/lib/python3.5/posixpath.py:91    line         return path
         /usr/lib/python3.5/posixpath.py:91    return    <= join: 'a/b'
'a/b'
In a terminal it would look like:
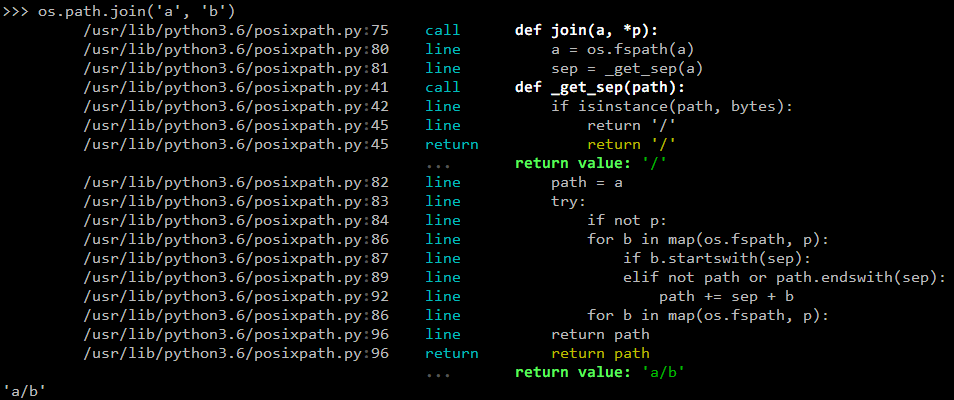
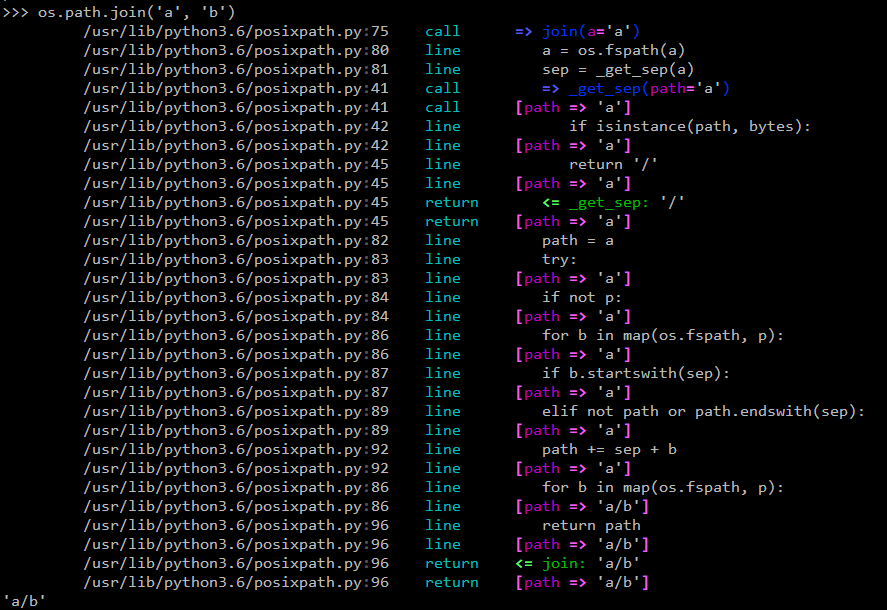
With VarsPrinter:
import hunter
# note that this kind of invocation will also use the default `CodePrinter`
hunter.trace(hunter.Q(module='posixpath', action=hunter.VarsPrinter('path')))

import os
os.path.join('a', 'b')
Would result in:
>>> os.path.join('a', 'b')
         /usr/lib/python3.5/posixpath.py:71    call      def join(a, *p):
         /usr/lib/python3.5/posixpath.py:76    line          sep = _get_sep(a)
                                               vars      path => 'a'
         /usr/lib/python3.5/posixpath.py:39    call      def _get_sep(path):
                                               vars      path => 'a'
         /usr/lib/python3.5/posixpath.py:40    line          if isinstance(path, bytes):
                                               vars      path => 'a'
         /usr/lib/python3.5/posixpath.py:43    line              return '/'
                                               vars      path => 'a'
         /usr/lib/python3.5/posixpath.py:43    return            return '/'
                                               ...       return value: '/'
         /usr/lib/python3.5/posixpath.py:77    line          path = a
                                               vars      path => 'a'
         /usr/lib/python3.5/posixpath.py:78    line          try:
                                               vars      path => 'a'
         /usr/lib/python3.5/posixpath.py:79    line              if not p:
                                               vars      path => 'a'
         /usr/lib/python3.5/posixpath.py:81    line              for b in p:
                                               vars      path => 'a'
         /usr/lib/python3.5/posixpath.py:82    line                  if b.startswith(sep):
                                               vars      path => 'a'
         /usr/lib/python3.5/posixpath.py:84    line                  elif not path or path.endswith(sep):
                                               vars      path => 'a'
         /usr/lib/python3.5/posixpath.py:87    line                      path += sep + b
                                               vars      path => 'a/b'
         /usr/lib/python3.5/posixpath.py:81    line              for b in p:
                                               vars      path => 'a/b'
         /usr/lib/python3.5/posixpath.py:91    line          return path
                                               vars      path => 'a/b'
         /usr/lib/python3.5/posixpath.py:91    return        return path
                                               ...       return value: 'a/b'
'a/b'
In a terminal it would look like:
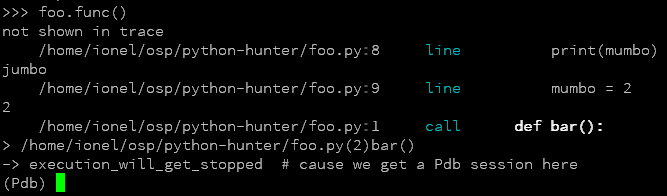
You can give it a tree-like configuration where you can optionally configure specific actions for parts of the tree (like dumping variables or a pdb set_trace):
from hunter import trace, Q, Debugger
from pdb import Pdb

trace(
    # drop into a Pdb session if ``foo.bar()`` is called
    Q(module="foo", function="bar", kind="call", action=Debugger(klass=Pdb))
    |  # or
    Q(
        # show code that contains "mumbo.jumbo" on the current line
        lambda event: event.locals.get("mumbo") == "jumbo",
        # and it's not in Python's stdlib
        stdlib=False,
        # and it contains "mumbo" on the current line
        source__contains="mumbo"
    )
)

import foo
foo.func()
With a foo.py like this:
def bar():
    execution_will_get_stopped  # cause we get a Pdb session here

def func():
    mumbo = 1
    mumbo = "jumbo"
    print("not shown in trace")
    print(mumbo)
    mumbo = 2
    print(mumbo) # not shown in trace
    bar()
We get:
>>> foo.func()
not shown in trace
    /home/ionel/osp/python-hunter/foo.py:8     line          print(mumbo)
jumbo
    /home/ionel/osp/python-hunter/foo.py:9     line          mumbo = 2
2
    /home/ionel/osp/python-hunter/foo.py:1     call      def bar():
> /home/ionel/osp/python-hunter/foo.py(2)bar()
-> execution_will_get_stopped  # cause we get a Pdb session here
(Pdb)
In a terminal it would look like:
Tracing processes
In similar fashion to strace Hunter can trace other processes, eg:
hunter-trace --gdb -p 123
If you wanna play it safe (no messy GDB) then pip install 'hunter[remote]' and add this in your code:
from hunter import remote
remote.install()
Then you can do:
hunter-trace -p 123
See docs on the remote feature.
Note: Windows ain’t supported.
Environment variable activation
For your convenience environment variable activation is available. Just run your app like this:
PYTHONHUNTER="module='os.path'" python yourapp.py
On Windows you’d do something like:
set PYTHONHUNTER=module='os.path'
python yourapp.py
The activation works with a clever .pth file that checks for that env var presence and before your app runs does something
like this:
from hunter import *
trace(<whatever-you-had-in-the-PYTHONHUNTER-env-var>)
Note that Hunter is activated even if the env var is empty, eg: PYTHONHUNTER="".
Filtering DSL
Hunter supports a flexible query DSL, see the introduction.
FAQ
Why not Smiley?
There’s some obvious overlap with smiley but there are few fundamental differences:
Complexity. Smiley is simply over-engineered:
- It uses IPC and a SQL database.
- It has a webserver. Lots of dependencies.
- It uses threads. Side-effects and subtle bugs are introduced in your code.
- It records everything. Tries to dump any variable. Often fails and stops working.
Why do you need all that just to debug some stuff in a terminal? Simply put, it’s a nice idea but the design choices work against you when you’re already neck-deep into debugging your own code. In my experience Smiley has been very buggy and unreliable. Your mileage may vary of course.
Tracing long running code. This will make Smiley record lots of data, making it unusable.
Now because Smiley records everything, you’d think it’s better suited for short programs. But alas, if your program runs quickly then it’s pointless to record the execution. You can just run it again.
It seems there’s only one situation where it’s reasonable to use Smiley: tracing io-bound apps remotely. Those apps don’t execute lots of code, they just wait on network so Smiley’s storage won’t blow out of proportion and tracing overhead might be acceptable.
Use-cases. It seems to me Smiley’s purpose is not really debugging code, but more of a “non interactive monitoring” tool.
In contrast, Hunter is very simple:
Few dependencies.
Low overhead (tracing/filtering code has an optional Cython extension).
No storage. This simplifies lots of things.
The only cost is that you might need to run the code multiple times to get the filtering/actions right. This means Hunter is not really suited for “post-mortem” debugging. If you can’t reproduce the problem anymore then Hunter won’t be of much help.
Why not pytrace?
Pytrace is another tracer tool. It seems quite similar to Smiley - it uses a sqlite database for the events, threads and IPC.
TODO: Expand this.
Why (not) coverage?
For purposes of debugging coverage is a great tool but only as far as “debugging by looking at what code is (not) run”. Checking branch coverage is good but it will only get you as far.
From the other perspective, you’d be wondering if you could use Hunter to measure coverage-like things. You could do it but for that purpose Hunter is very “rough”: it has no builtin storage. You’d have to implement your own storage. You can do it but it wouldn’t give you any advantage over making your own tracer if you don’t need to “pre-filter” whatever you’re recording.
In other words, filtering events is the main selling point of Hunter - it’s fast (cython implementation) and the query API is flexible enough.